Digi-Twin · Network AI Brain

The only bitemporal twin
see your network as it was and as you knew it.

Digi-Twin maintains a live graph of devices, services, customers and faults, letting teams inspect the network now, revisit past states and test planned actions safely.

Unified network & KPI view

Digital twin

List top 3 paths between r1 and r7

Top paths from r1 to r7 Path 1: r1/4 → r3/6 → r7/10 Capacity 1000 MB · Downtime 2333 min Path 2: r1/3 → r4/5 → r7/10 Capacity 1000 MB · Downtime 2350 min

Shortest path between r1 & r7?

Intent driven

96% Reliability Trends

Network utilisation

Feb 2024 – Mar 2025

68%

Network simulation running

2× timeValid-time and transaction-time history
60%Reduction in MTTR
98%Capacity forecasting accuracy
TMFOpen APIs 638 and 639

Use case intelligence

One AI brain for network, customer and sales

One shared graph links live network state with services, customers and business goals, giving every team the same trusted operational context.

Connected business domains Operational intelligence
03 use cases

Digitize networks to proactively identify issues and reduce MTTR, service downtime and improve capacity forecasting, resulting in fewer truck rolls and improved field force effectiveness.

Outcome 01 60% reduction in MTTR Outcome 02 80% reduction in service downtime during migrations Outcome 03 98% accuracy in capacity forecasting

Digitize personalized interactions across channels to reduce churn and increase ARPU, NPS and LTV by identifying the right product, price and channel for every customer.

Outcome 01 35% increase in audience LTV Outcome 02 20% improvement in NPS score Outcome 03 40% reduction in customer churn

AI-curated sales intelligence and model-based quotation creation for higher win rates, giving sales teams and channel partners AI-generated pricing and configuration with revenue-opportunity insight.

Outcome 01 22% increase in opportunity conversion Outcome 02 20% increase in sales conversion Outcome 03 30% reduction in sales cycle duration

Core capabilities

The data layer that makes AI-driven operations possible

Four connected capabilities join fragmented network data, track change, map service impact and support safe simulation for people and AI agents.

Network reality

Context + time Living knowledge graph Every entity. Every relationship. Every version.

Unified view

A near real-time, unified view of network, customers and sales, turning data into actionable insights for data-driven decisions.

What-if analysis

A reasoning-led AI brain evaluates strategic decisions across network planning, product launches and CX, enabling proactive action before execution.

Scenario simulation

AI-driven simulations for forecasting, prediction and impact analysis, without disrupting live operations.

Knowledge graph

Maps entity relationships across network, customer journey and sales engagement into one graph, enabling contextual insight and autonomous reasoning at scale.

AI Ops

From raw alarms to explainable, predicted incidents

The AI Ops pipeline groups raw alarms, finds likely causes, maps service impact and supports earlier action with clear evidence.

01 Signal intelligence

Automated alarm correlation

Correlates topology and temporal signals, enriches them with graph impact and ranks likely root causes with confidence and a causal chain—turning alarm floods into actionable incidents.

Alarm flood Ranked incident
02 Governed learning

Learned correlation rules engine

Mines patterns from real incidents and proposes explainable temporal rules. Operators review and approve every rule before it enters the live correlation engine.

Observed patterns Approved rule
03 Predictive assurance

Predictive fault & capacity forecasting

Forecasts link utilization and threshold breaches while streaming anomaly scores, exposing capacity and fault risks before they affect service.

Live telemetry Early warning
04 Bitemporal state

Bitemporal knowledge graph (time-travel)

Stores valid-time and transaction-time for every network fact. History remains queryable for audits, forensic review and point-in-time reconstruction.

Network fact Queryable history

How it works

Network Digi-Twin

TelcoCore turns inventory, topology, telemetry, alarms and service data into a live graph for fault detection, impact analysis and safe scenario testing.

Global Internet Access MPLS Access ce01 ce02 cs01 as01 as04 as10 as02 as03 as05 as06 as07 as08 as09 as11 Access network Mapped device Live relationship

In production

Proven across network, sales and customer teams

One current network model helps operations, planning, sales and care teams make faster decisions from the same trusted facts.

Satellite communications dish overlooking a city

Network

70% reduction in network fault troubleshooting time

Accelerated network fault resolution

A U.S.-based satellite provider enriched live network statistics with location, weather, coverage and telemetry data—accelerating automated root-cause analysis and fault isolation.

Dynamic knowledge graph Automated root-cause analysis
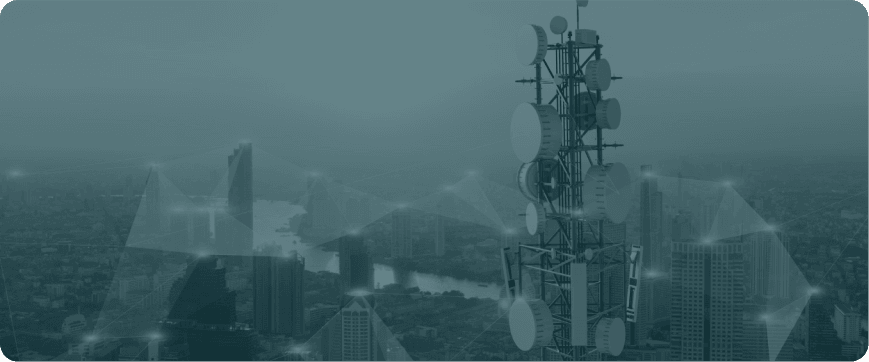
Telecom tower connected across an urban network

Sales

60% faster time to market

AI-powered product configuration

A UK telecom operator used Digi-Twin to identify reusable service paths and generate TM Forum SID-aligned CFS/RFS models directly from its product catalog.

Reusable CFS/RFS models TM Forum SID aligned
Customer completing a retail purchase at a connected point of sale

Customer

engagement rate in campaigns

Data-driven customer management

A leading European CSP uses live behavior and consumption signals to build high-impact segments, simulate outcomes and trigger AI-personalized offers across channels.

Live usage segmentation Personalized omnichannel offers

"Really impressed with NetoAI solutions around network fault prediction and AI-driven closed-loop automation."

Chief Data Officer, European Network Operator

Digi-Twin · Network AI Brain

See your network as a living twin

Schedule a demo
Schedule a demo

Tell us a little about your network and our team will tailor the walkthrough.